
|
|
All S-NPP VI products, as was the case with EOS-MODIS and AVHRR, are suitable for the study of land surface vegetation short, medium, and long term patterns, trends and anomalies and are capable of supporting various ecosystem, biogeochemical, and climate models by providing key information about land the surface and vegetation cover. However, the error and uncertainty associated with these Vegetation Index products are sometimes quite large, complex, and time and space dependent. VI products need to be well characterized in order to promote accurate and proper use of the time series. It is however practically impossible to directly quantify the error in a vegetation index product due to the nature of the index itself, the underlying remote sensing data, and the spatial and temporal context.
One can still explore other quasi-quantitative methods that aim to simply characterizing these records and elicit their general error and uncertainty. Here we are proposing a simple framework (Fig. 1) and set of metrics to help characterize and capture the error and uncertainty in these products. In addition, a global spatially explicit statistical analysis is also proposed to help establish the error and characterize the data record. The methods proposed and discussed here are quasi-quantitative and meant to help characterize the product suite error and not validate the product.
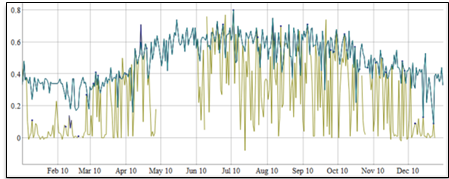
Figure 1. Error and Uncertainty model framework
The proposed framework should be spatially and temporally explicit, and is designed to capture key features of these data records:
* Impact and quality of the atmosphere correction: This is a key characteristic, and while current atmosphere correction algorithms are capable of addressing and correcting a host of atmosphere issues (water vapor, ozone, Rayleigh scattering, and light to medium aerosols, viewing geometry) their performance is always an issue. In many situations the correction actually exacerbates the problems due to ingesting poor quality ancillary data needed to drive the atmosphere correction algorithm.
* Departure from the long term average: The departure although can result from natural factors (growing season or response to drivers), is in many cases the result of noise and error in the data. The departure will be measured by the absolute distance from the long term average. To separate the noise from natural change, the error related departures are identified by examining their persistence. A sustained departure is most likely the result of a natural change/disturbance and not an error in the data.
* Temporal profile noise: Although, the VI temporal profiles capture and reflect the natural cycle of vegetation dynamic, they can also result from noise and error in the underlying input data. Random and large oscillation about the long term average are most likely the result of error in the data and cannot be attributed to natural and gradual vegetation dynamic.
Using this framework, the error is portioned into three categories (Fig. 2):
1. Error related to input (1): Which could be estimated from accurate atmospherically corrected data over validation sites (ex: Aeronet/Sunphotometer sites, Holben et al. 2006).
2. Departure from normal/stable profile (2): Based on long term standard deviations and statistical analyses of the records.
3. Temporal profile noise/stability (3): Will be based on change about normal/mean. This indicates noise in data records and inhibits the profile characterization especially in the context of phenology metrics extraction.
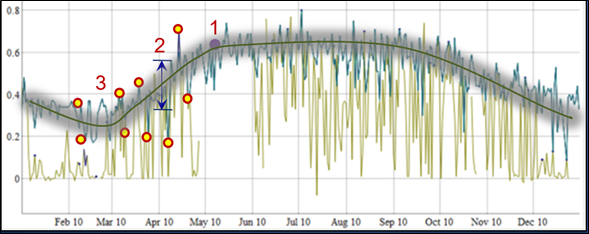
Figure 2. Error Model
Herein, we’re not concerned with the VI formulation, but the error in the input to the VI equation and how it translates into a VI error (envelope). This measures how close to the actual top of canopy the reflectance values are (TOC), which is an indication of the ability to remove all atmosphere contamination by the atmosphere correction algorithm.
To estimate this error, we use Surface Reflectance data from validation sites (ex: sunphotometers measurements over EOS Core validation sites, work maintained by the Land Product Validation group, LPV). The LSR error was estimated (EOS MODIS LPV website, http://landval.gsfc.nasa.gov/ and https://lpvs.gsfc.nasa.gov/) to average about 2-5% in the Red & NIR for high quality data (Vermote et al, https://landval.gsfc.nasa.gov/ProductStatus.php?ProductID=MOD09). This corresponds to the general error in estimating the surface reflectance under no clouds, no residual clouds, no to minimum aerosol, and ideal atmosphere conditions. Using an ad-hoc approach we can then model a maximum error, assuming the presence of residual to medium aerosols loads, of about ±10% in the Red/NIR reflectance. This means an assumption of double the error reported over sunphotometer sites in estimating the land surface reflectance under less than ideal conditions, or 10% error. Using a simple and direct transfer function we can estimate the impact of this surface reflectance error on the VI using the equation (Fig. 3).
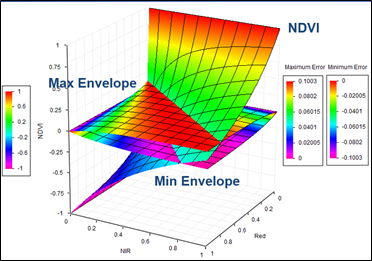
Figure 3. Input surface Reflectance error impact on estimating NDVI
